Tutorial for LWPolyline
The LWPolyline (lightweight polyline) was introduced in
DXF R13/14 and it is defined as a single graphic entity, which differs from the
old-style Polyline entity, which is defined as a group
of sub-entities. It is recommended to prefer the LWPOLYLINE over the 2D POLYLINE
entity because it requires less space in memory and in DXF files and displays
faster in AutoCAD.
Important
The LWPOLYLINE is a planar element, therefore the (x, y) point coordinates are
located in the OCS and the z-axis is stored in the
LWPolyline.dxf.elevation attribute.
The method vertices_in_wcs returns the
polyline vertices as WCS coordinates.
Create a simple polyline:
import ezdxf

doc = ezdxf.new("R2000")
msp = doc.modelspace()

points = [(0, 0), (3, 0), (6, 3), (6, 6)]
msp.add_lwpolyline(points)

doc.saveas("lwpolyline1.dxf")
Append multiple points to a polyline:
doc = ezdxf.readfile("lwpolyline1.dxf")
msp = doc.modelspace()

line = msp.query("LWPOLYLINE").first
if line is not None:
    line.append_points([(8, 7), (10, 7)])

doc.saveas("lwpolyline2.dxf")
The index operator [] always returns polyline points as 5-tuple
(x, y, start_width, end_width, bulge), the start_width, end_width and
bulge values are 0 if not present:
first_point = line[0]
x, y, start_width, end_width, bulge = first_point
The context manager points() can be used to edit
polyline points, this method was introduced because accessing individual
points was very slow in early versions of ezdxf, in current versions of ezdxf the
direct access by the index operator [] is very fast and using the context
manager is not required anymore, but the context manager still exist and has the
advantage of supporting an user defined point format:
doc = ezdxf.readfile("lwpolyline2.dxf")
msp = doc.modelspace()

line = msp.query("LWPOLYLINE").first

with line.points("xyseb") as points:
    # points is a standard Python list
    # existing points are 5-tuples, but new points can be
    # set as (x, y, [start_width, [end_width, [bulge]]]) tuple
    # set start_width, end_width to 0 to be ignored (x, y, 0, 0, bulge).

    # delete last 2 points
    del points[-2:]
    # adding two points
    points.extend([(4, 7), (0, 7)])

doc.saveas("lwpolyline3.dxf")
Each line segment can have a different start- and end width, if omitted start- and end width is 0:
doc = ezdxf.new("R2000")
msp = doc.modelspace()

# point format = (x, y, [start_width, [end_width, [bulge]]])
# set start_width, end_width to 0 to be ignored (x, y, 0, 0, bulge).

points = [(0, 0, .1, .15), (3, 0, .2, .25), (6, 3, .3, .35), (6, 6)]
msp.add_lwpolyline(points)

doc.saveas("lwpolyline4.dxf")
The first point carries the start- and end-width of the first segment, the
second point of the second segment and so on, the start- and end width value
of the last point is used for the closing segment if the polyline is closed
else these values are ignored.
Start- and end width only works if the DXF attribute dxf.const_width is
unset, delete it to be sure it’s unset:
# no exception will be raised if const_width is already unset:
del line.dxf.const_width
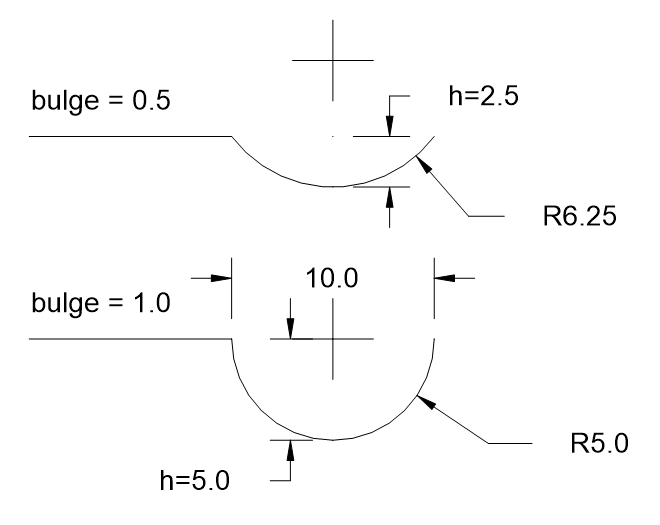
LWPolyline can also have curved elements, they are defined by the
Bulge value:
doc = ezdxf.new("R2000")
msp = doc.modelspace()

# point format = (x, y, [start_width, [end_width, [bulge]]])
# set start_width, end_width to 0 to be ignored (x, y, 0, 0, bulge).

points = [(0, 0, 0, .05), (3, 0, .1, .2, -.5), (6, 0, .1, .05), (9, 0)]
msp.add_lwpolyline(points)

doc.saveas("lwpolyline5.dxf")
The curved segment is drawn from the point which defines the bulge value to the following point, the curved segment is always an arc. The bulge value defines the ratio of the arc sagitta (segment height h) to half line segment length (point distance), a bulge value of 1 defines a semicircle. The curve is on the right side of the line for a bulge value > 0, and on the left side of the line for a bulge value < 0.
Helper functions to handle bulge values: Bulge Related Functions
The user defined point format, default is xyseb:
x= x coordinate
y= y coordinate
s= start width
e= end width
b= bulge value
v= (x, y) as tuple
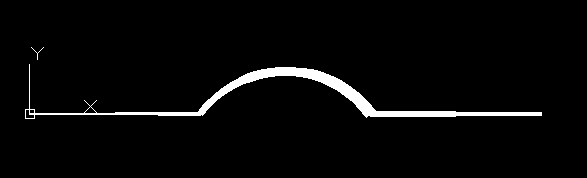
msp.add_lwpolyline([(0, 0, 0), (10, 0, 1), (20, 0, 0)], format="xyb")
msp.add_lwpolyline([(0, 10, 0), (10, 10, .5), (20, 10, 0)], format="xyb")