Drawing Add-on
This section consolidates the FAQ about the drawing add-on from the github forum.
All Backends
How to Set Background and Foreground Colors
Override the default background and foreground colors. The foreground color is the AutoCAD Color Index (ACI) 7, which is white/black depending on the background color. If the foreground color is not specified, the foreground color is white for dark backgrounds and black for light backgrounds. The required color format is a hex string “#RRGGBBAA”.
from ezdxf.addons.drawing.properties import LayoutProperties

# -x-x-x snip -x-x-x-

fig: plt.Figure = plt.figure()
ax: plt.Axes = fig.add_axes((0, 0, 1, 1))
ctx = RenderContext(doc)

# get the modelspace properties
msp_properties = LayoutProperties.from_layout(msp)

# set light gray background color and black foreground color
msp_properties.set_colors("#eaeaea")
out = MatplotlibBackend(ax)

# override the layout properties and render the modelspace
Frontend(ctx, out).draw_layout(
    msp,
    finalize=True,
    layout_properties=msp_properties,
)
fig.savefig("image.png")
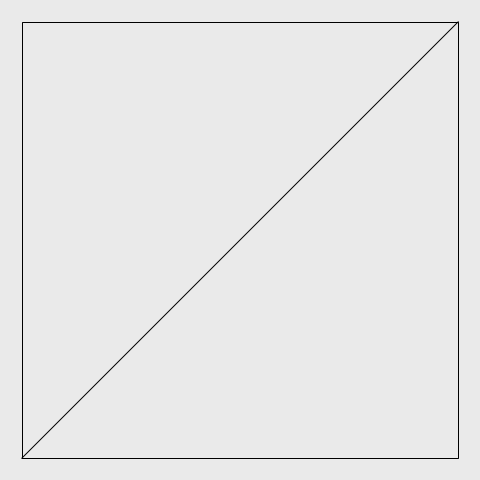
A light background “#eaeaea” has a black foreground color by default:
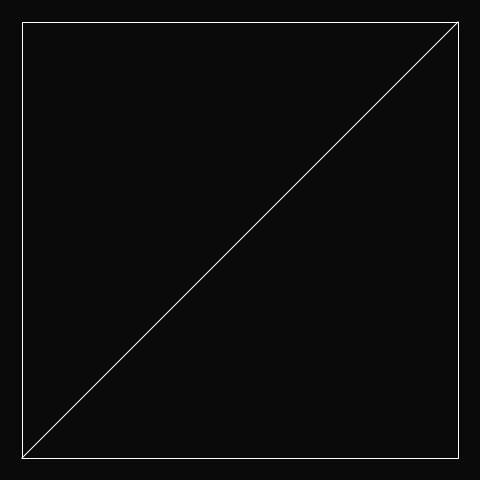
A dark background “#0a0a0a” has a white foreground color by default:
# -x-x-x snip -x-x-x-

msp_properties.set_colors("#0a0a0a")

# -x-x-x snip -x-x-x-
How to Set a Transparent Background Color
The override color include an alpha transparency “#RRGGBBAA” value. An alpha value of “00” is opaque and “ff” is fully transparent. A transparent background color still defines the foreground color!
Hint
The savefig() function of the matplotlib backend requires the
transparent argument to be set to True to support transparency.
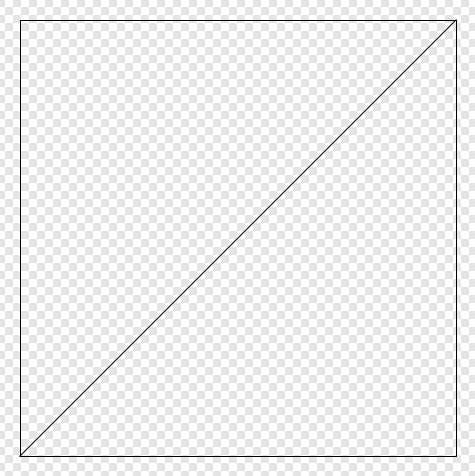
A light and fully transparent background “#eaeaeaff” has a black foreground color by default:
# -x-x-x snip -x-x-x-

msp_properties.set_colors("#eaeaeaff")

# -x-x-x snip -x-x-x-

fig.savefig("image.png", transparent=True)
A dark and fully transparent background “#0a0a0aff” has a white foreground color by default:
# -x-x-x snip -x-x-x-

msp_properties.set_colors("#0a0a0aff")

# -x-x-x snip -x-x-x-

fig.savefig("image.png", transparent=True)

How to Exclude DXF Entities from Rendering
If all unwanted entities are on the same layer switch off the layer.
If the document is not saved later, you can delete the entities or set them invisible.
Filter the unwanted entities by a filter function.
The argument filter_func of the Frontend.draw_layout() method expects a
function which takes a graphical DXF entity as input and returns True if the
entity should be rendered or False to exclude the entity from rendering.
This filter function excludes all DXF entities with an ACI color value of 2:
from ezdxf.entities import DXFGraphic

def my_filter(e: DXFGraphic) -> bool:
    return e.dxf.color != 2

# -x-x-x snip -x-x-x-

Frontend(ctx, out).draw_layout(msp, finalize=True, filter_func=my_filter)
Important
Not all attributes have a default value if the attribute does not exist.
If you are not sure about this, use the get() method:
def my_filter(e: DXFGraphic) -> bool:
    return e.dxf.get("color", 7) != 2
How to Override Properties of DXF Entities
Create a custom Frontend class and override the the
override_properties() method:
class MyFrontend(Frontend):
    def override_properties(self, entity: DXFGraphic, properties: Properties) -> None:
        # remove alpha channel from all entities, "#RRGGBBAA"
        properties.color = properties.color[:7]

# -x-x-x snip -x-x-x-

MyFrontend(ctx, out).draw_layout(msp, finalize=True)
Matplotlib Backend
See also
Matplotlib package: https://matplotlib.org/stable/api/matplotlib_configuration_api.html
FigureAPI: https://matplotlib.org/stable/api/figure_api.html
How to Get the Pixel Coordinates of DXF Entities
See also
Transformation from modelspace coordinates to image coordinates:
import matplotlib.pyplot as plt
from PIL import Image, ImageDraw

import ezdxf
from ezdxf.math import Matrix44
from ezdxf.addons.drawing import RenderContext, Frontend
from ezdxf.addons.drawing.matplotlib import MatplotlibBackend

def get_wcs_to_image_transform(
    ax: plt.Axes, image_size: tuple[int, int]
) -> Matrix44:
    """Returns the transformation matrix from modelspace coordinates to image
    coordinates.
    """

    x1, x2 = ax.get_xlim()
    y1, y2 = ax.get_ylim()
    data_width, data_height = x2 - x1, y2 - y1
    image_width, image_height = image_size
    return (
        Matrix44.translate(-x1, -y1, 0)
        @ Matrix44.scale(
            image_width / data_width, -image_height / data_height, 1.0
        )
        # +1 to counteract the effect of the pixels being flipped in y
        @ Matrix44.translate(0, image_height + 1, 0)
    )

# create the DXF document
doc = ezdxf.new()
msp = doc.modelspace()
msp.add_lwpolyline([(0, 0), (1, 0), (1, 1), (0, 1)], close=True)
msp.add_line((0, 0), (1, 1))

# export the pixel image
fig: plt.Figure = plt.figure()
ax: plt.Axes = fig.add_axes([0, 0, 1, 1])
ctx = RenderContext(doc)
out = MatplotlibBackend(ax)
Frontend(ctx, out).draw_layout(msp, finalize=True)
fig.savefig("cad.png")
plt.close(fig)

# reload the pixel image by Pillow (PIL)
img = Image.open("cad.png")
draw = ImageDraw.Draw(img)

# add some annotations to the pixel image by using modelspace coordinates
m = get_wcs_to_image_transform(ax, img.size)
a, b, c = (
    (v.x, v.y)  # draw.line() expects tuple[float, float] as coordinates
    # transform modelspace coordinates to image coordinates
    for v in m.transform_vertices([(0.25, 0.75), (0.75, 0.25), (1, 1)])
)
draw.line([a, b, c, a], fill=(255, 0, 0))

# show the image by the default image viewer
img.show()
How to Get Modelspace Coordinates from Pixel Coordinates
This is the reverse operation of the previous how-to: How to Get the Pixel Coordinates of DXF Entities
See also
Full example script: wcs_to_image_coordinates.py
def get_image_to_wcs_transform(
    ax: plt.Axes, image_size: tuple[int, int]
) -> Matrix44:
    m = get_wcs_to_image_transform(ax, image_size)
    m.inverse()
    return m

# -x-x-x snip -x-x-x-

img2wcs = get_image_to_wcs_transform(ax, img.size)
print(f"0.25, 0.75 == {img2wcs.transform(a).round(2)}")
print(f"0.75, 0.25 == {img2wcs.transform(b).round(2)}")
print(f"1.00, 1.00 == {img2wcs.transform(c).round(2)}")
How to Export a Specific Area of the Modelspace
This code exports the specified modelspace area from (5, 3) to (7, 8) as a 2x5 inch PNG image to maintain the aspect ratio of the source area.
Use case: render only a specific area of the modelspace.
See also
Full example script: export_specific_area.py
# -x-x-x snip -x-x-x-

# export the pixel image
fig: plt.Figure = plt.figure()
ax: plt.Axes = fig.add_axes([0, 0, 1, 1])
ctx = RenderContext(doc)
out = MatplotlibBackend(ax)
Frontend(ctx, out).draw_layout(msp, finalize=True)

# setting the export area:
xmin, xmax = 5, 7
ymin, ymax = 3, 8
ax.set_xlim(xmin, xmax)
ax.set_ylim(ymin, ymax)

# set the output size to get the expected aspect ratio:
fig.set_size_inches(xmax - xmin, ymax - ymin)
fig.savefig("x5y3_to_x7y8.png")
plt.close(fig)
How to Render Without Margins
To remove the empty space at the image borders set the margins of the
Axes object to zero:
ax.margins(0)
fig.savefig("image_without_margins.png")
plt.close(fig)
See also
Matplotlib docs about margins
How to Set the Pixel Count per Drawing Unit
This code exports the modelspace with an extent of 5 x 3 drawing units with 100 pixels per drawing unit as a 500 x 300 pixel image.
Use case: render the content with a fixed number of pixels for a drawing unit, e.g. a drawing unit of 1 inch should be rendered by 100 pixels.
See also
Full example script: export_image_pixel_size.py
# -x-x-x snip -x-x-x-

def set_pixel_density(fig: plt.Figure, ax: plt.Axes, ppu: int):
    """Argument `ppu` is pixels per drawing unit."""
    xmin, xmax = ax.get_xlim()
    width = xmax - xmin
    ymin, ymax = ax.get_ylim()
    height = ymax - ymin
    dpi = fig.dpi
    width_inch = width * ppu / dpi
    height_inch = height * ppu / dpi
    fig.set_size_inches(width_inch, height_inch)

# -x-x-x snip -x-x-x-

# export image with 100 pixels per drawing unit = 500x300 pixels
set_pixel_density(fig, ax, 100)
fig.savefig("box_500x300.png")
plt.close(fig)
How to Export a Specific Image Size in Pixels
This code exports the modelspace with an extent of 5 x 3 drawing units as a 1000 x 600 pixel Image.
Use case: render the content with a fixed image size in pixels.
See also
Full example script: export_image_pixel_size.py
# -x-x-x snip -x-x-x-

def set_pixel_size(fig: plt.Figure, size: tuple[int, int]):
    x, y = size
    fig.set_size_inches(x / fig.dpi, y / fig.dpi)

# -x-x-x snip -x-x-x-

# export image with a size of 1000x600 pixels
set_pixel_size(fig, (1000, 600))
fig.savefig("box_1000x600.png")
plt.close(fig)
How to Set the Page Size in Inches
The page- or image size in inches is set by the set_size_inches() method
of the Figure class. The content within the Axes limits will
be scaled to fill the page.
Use case: render the whole content to a PDF document with a specific paper size without worrying about scale.
fig.set_size_inches(8, 11)
How to Render at a Specific Scale
This code exports the modelspace at a specific scale and paper size.
Use case: render the content to a PDF document with a specific paper size and scale, but not all content may be rendered.
See also
Full example script: render_to_scale.py
# -x-x-x snip -x-x-x-

def render_limits(
    origin: tuple[float, float],
    size_in_inches: tuple[float, float],
    scale: float,
) -> tuple[float, float, float, float]:
    """Returns the final render limits in drawing units.

    Args:
         origin: lower left corner of the modelspace area to render
         size_in_inches: paper size in inches
         scale: render scale, e.g. scale=100 means 1:100, 1m is
             rendered as 0.01m or 1cm on paper

    """
    min_x, min_y = origin
    max_x = min_x + size_in_inches[0] * scale
    max_y = min_y + size_in_inches[1] * scale
    return min_x, min_y, max_x, max_y


def export_to_scale(
    paper_size: tuple[float, float] = (8.5, 11),
    origin: tuple[float, float] = (0, 0),
    scale: float = 1,
    dpi: int = 300,
):
    """Render the modelspace content with to a specific paper size and scale.

    Args:
        paper_size: paper size in inches
        origin: lower left corner of the modelspace area to render
        scale: render scale, e.g. scale=100 means 1:100, 1m is
            rendered as 0.01m or 1cm on paper
        dpi: pixel density on paper as dots per inch

    """
    # -x-x-x snip -x-x-x-

    ctx = RenderContext(doc)
    fig: plt.Figure = plt.figure(dpi=dpi)
    ax: plt.Axes = fig.add_axes([0, 0, 1, 1])

    # disable all margins
    ax.margins(0)

    # get the final render limits in drawing units:
    min_x, min_y, max_x, max_y = render_limits(
        origin, paper_size, scale
    )

    ax.set_xlim(min_x, max_x)
    ax.set_ylim(min_y, max_y)

    out = MatplotlibBackend(ax)
    # finalizing invokes auto-scaling by default!
    Frontend(ctx, out).draw_layout(msp, finalize=False)

    # set output size in inches:
    fig.set_size_inches(paper_size[0], paper_size[1], forward=True)

    fig.savefig(f"image_scale_1_{scale}.pdf", dpi=dpi)
    plt.close(fig)
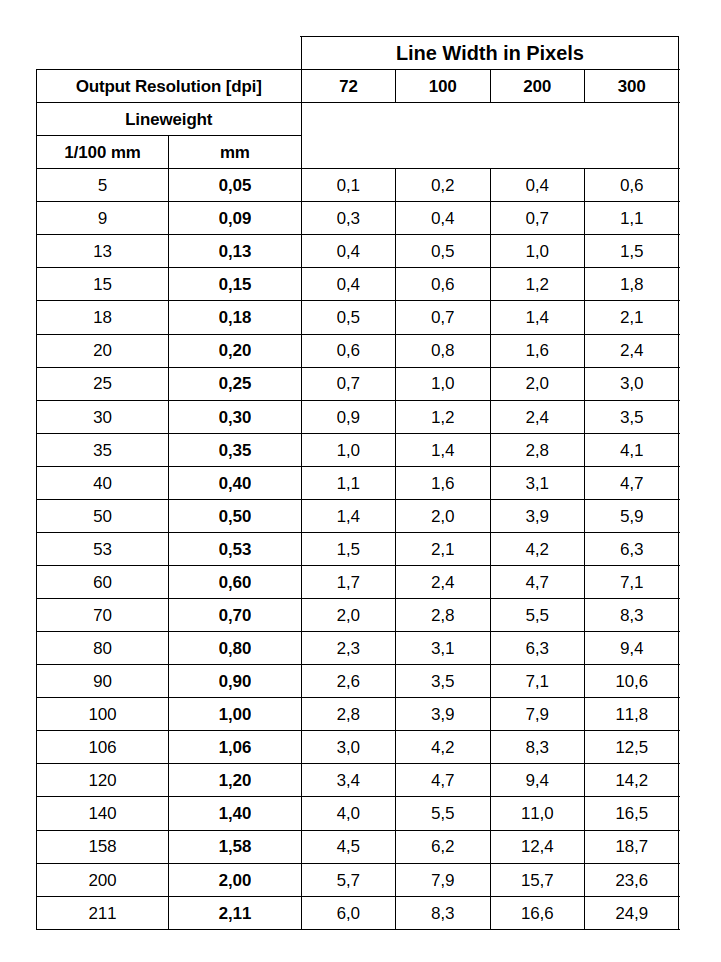
How to Control the Line Width
The DXF lineweight attribute defines the line width as absolute width on the
output medium (e.g. 25 = 0.25mm) and therefore depends only on the DPI (dots per inch)
setting of the Figure class and the savefig() method.
There are two additional settings in the Configuration
class which influences the line width:
min_lineweightsets the minimum line width in 1/300 inch - a value of 300 is a line width of 1 inchlineweight_scaling, multiply the line width by a this factor
The following table shows the line width in pixels for all valid DXF lineweights for a resolution of 72, 100, 200 and 300 dpi:
See also
Discussion: https://github.com/mozman/ezdxf/discussions/797